
May This Be the Last Oneful Start to the Year
Digressing into March, we must open our monthly market commentary with — surprise, surprise — the news that a new war front has emerged. Our readers have undoubtedly been bombarded (pardon the pun) with information, anecdotes, insights and, inevitably, conspiracy theories regarding the joint U.S.–Israeli attack on Iran. We will therefore refrain from revisiting the operational details of what is unfolding. Instead, we prefer to assess the potential consequences of the conflict and outline a set of scenarios that we consider plausible over the coming months and based on current available information.
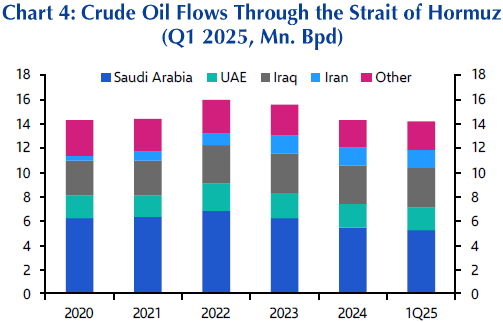
Our primary assumption is that this conflict will not escalate into a Third World War It is reasonable to believe that the attacks occurred with at least tacit clearance from both Russia and China, given their strategic interests in the region — particularly regarding Iranian oil supply. Setting aside, for the moment, an Armageddon scenario, the next critical variable is the price of energy — chiefly oil and natural gas — as these may largely determine the trajectory of inflation and economic growth across continents, albeit to varying degrees. Unsurprisingly, both crude oil and natural gas prices have risen sharply. At the time of writing, WTI trades around USD 76 per barrel (up 33% year-to-date), while natural gas stands near EUR 55/MWh (up almost 100% YTD). These increases are meaningful, yet still far below the peaks reached in 2022 following Russia’s Special Operation in the Ukraine, when WTI briefly touched USD 130 per barrel and natural gas surged to EUR 340/MWh. Current levels suggest markets are pricing in some disruption to energy sourcing and delivery. What they are not yet pricing is a prolonged closure of the Strait of Hormuz — the strategic chokepoint used by most OPEC+ members to transport oil and gas globally.
Why is the Strait of Hormuz so critical? Because it accounts for roughly 25% of global seaborne oil shipments and approximately 20% of global natural gas flows. While alternative routes exist for oil, capacity constraints would allow for the rerouting of no more than roughly 30% of current volumes. For natural gas, there is effectively no substitute route. As long as the passage remains at least partially operational, energy prices should stabilize near current levels, albeit with elevated volatility. Iran itself may have limited incentive to shut the Strait entirely. Oil revenues constitute a vital source of national income. Moreover, a full closure would likely harden the stance of neighboring countries — thus far only partially involved — as well as that of key allies, China foremost among them, which could face supply deficits once reserves are depleted. Strategically, the threat of closure may prove more effective than the act itself: deterrence often exerts more pressure than execution, and at a significantly lower economic and military cost for a country already operating under strained finances and resources. Nevertheless, a worst-case scenario cannot be ruled out. As Capital Economics aptly noted, if Iran’s ability to export oil from Kharg Island — which handles over 90% of its oil exports — were materially impaired, or if the regime concluded it had little left to lose, the probability of a full closure of the Strait could rise dramatically.
Two broad scenarios present themselves. In the first, the conflict concludes within a limited timeframe — weeks, perhaps a few months at most. Regardless of potential political changes within Iran, energy flows would normalize (with “normal” still implying sporadic disruptions), and prices would gradually retrace. A short-term spike in energy costs would likely have only marginal effects on global inflation and GDP, thus avoiding a meaningful shift in central bank policy. In short: a return to relative normality. In the second scenario, investors come to perceive the conflict as protracted — and potentially expanding geographically. The resulting uncertainty would likely push energy prices higher and keep them elevated. Time becomes the decisive variable: it determines whether the inflationary shock proves temporary or entrenched. A commonly cited rule of thumb suggests that a 5% increase in oil prices adds roughly 0.1 percentage points to inflation in developed markets. Should WTI rise to USD 100 per barrel and remain there, developed market inflation could increase by approximately 0.7 percentage points — at a time when inflation is already above target and, perhaps more importantly, perceived by households as uncomfortably high.
Developed markets, however, should not be treated as a homogeneous bloc. Recent equity market performance underscores significant regional divergences. The United States, now a net exporter of oil, benefits in part from higher energy prices, which support both fiscal revenues and energy sector profitability. While lower- and middle-income households would still experience pressure from higher fuel costs, we believe the impact on aggregate domestic consumption could be limited, aside from modestly higher inflation. This helps explain why the S&P 500 has remained broadly stable in recent trading sessions. Asia, by contrast, sits at the other end of the spectrum. Much of the oil shipped through the Gulf is destined for Asian economies, which lack meaningful short-term alternatives. These countries are therefore highly sensitive to sustained energy price increases. The twin risks of higher inflation and weaker GDP growth are particularly pronounced. The sharp two-day declines — roughly 19% in South Korea and around 10% in Thailand and Japan — illustrate this vulnerability. Europe positions itself somewhere in between. The recent jump in energy prices constitutes a mild stagflationary shock for the euro area. If sustained — for example, with Brent above USD 100 per barrel and natural gas remaining at current levels — inflation could rise by roughly 1 percentage point relative to current projections, while domestic activity might soften modestly. For more severe macroeconomic repercussions to materialize, energy prices — particularly natural gas — would need to increase further and remain elevated for a prolonged period. European equities declined roughly 4% over two trading days, reflecting the energy-intensive structure of the region’s economy. Central banks of these regions will be on high alert; they tend not to change stance with one-time shocks, but, in the unfortunate event higher prices will persist for longer, much of the interest rate cuts currently expected could be reversed and, new rate hikes cannot be ruled out. Yet, for now, we must wait as events unfold, uncertainty gradually recedes, and clearer signals emerge. One can only hope that civilian casualties remain limited and that a resolution is achieved swiftly.
Turning to macroeconomic data, February delivered several important releases confirming that the U.S. economy remains on relatively solid footing. Although Q4 2025 GDP came in below expectations — largely due to the government shutdown — most other indicators were constructive. The labor market appears stable: nonfarm payrolls increased by 130,000, while the unemployment rate eased to 4.3%. Inflation moderated slightly to 2.5% (from 2.6%), broadly in line with expectations. Housing data were also encouraging, with both building permits and housing starts exceeding prior readings and survey forecasts. The main soft spot was retail sales, which stagnated during the period under review. It is plausible that severe weather conditions may have played a significant role in this slowdown, though confirmation will require next month’s data. Meanwhile, the earnings season is drawing to a close and continues to support the resilience narrative: revenues have grown by 9.2% year-on-year, while earnings have expanded by 13.4%. At present, there are few convincing signals pointing toward an imminent recession.
In February, financial markets were influenced by a combination of macroeconomic and geopolitical factors. Key sources of uncertainty included renewed concerns surrounding artificial intelligence investments and the broader implications of AI implementation across multiple sectors, the decision of the U.S. Supreme Court to limit the use of the International Economic Emergency Powers Act as legal justification for reciprocal tariffs, and the generally positive economic and inflation data releases we mentioned earlier. The escalation between the United States-Israel, and Iran began on the final day of the month, after market close, and therefore did not impact February’s performance.
Against this backdrop, equity markets delivered divergent performances. Emerging markets (+5.5%) outperformed developed markets. The Euro Stoxx 600 posted a strong gain of +3.89%, while U.S. indices were affected by a rotation away from large cap technology stocks toward broader market segments. The S&P 500 declined by 0.76%, and the Nasdaq 100 fell by 2.26%, primarily reflecting weakness in software stocks. As a result, the MSCI World, heavily influenced by its U.S. weighting, closed the month up +0.76%.
In fixed income, investors’ preference for high quality issuers supported the investment grade segment, which gained 1.23% in USD and 0.55% in EUR terms. Emerging market bonds also posted positive returns of +0.98%. The high yield segment, while remaining in positive territory, lagged somewhat, closing the month at +0.11% in USD and +0.30% in EUR, probably due to extreme valuations.
Government bond markets experienced a broad-based decline in yields along the curve, supported by encouraging inflation data. In the United States and Germany, the two-year yields fell to 3.37% and 2.00%, respectively, while in Switzerland the two-year yield rose marginally by one basis point to -0.16%. At the ten-year maturity, yields declined across all three countries, reaching 3.94% in the United States, 2.64% in Germany, and 0.18% in Switzerland.
The commodities complex generated positive returns. Oil gained approximately 2% during the month before rising sharply when the markets opened in March. Gold rose to USD 5,278.93 per ounce (+7.86%), while silver, exhibiting higher volatility, followed the same upward trend and closed the month up +10.08%.
In currency markets, the U.S. dollar moved divergently against the euro and the Swiss franc. The EUR/USD exchange rate settled at 1.1812, reflecting a 0.33% depreciation of the euro, while USD/CHF showed a 0.48% weakening of the dollar, reaffirming the Swiss franc’s haven status during periods of heightened uncertainty. Finally, Bitcoin extended its downward trend, declining by a further 22.14% and closing the month at USD 65,527.34.
During the month, our discretionary portfolios slightly underperformed the benchmark. Fixed income underperformed, with investment-grade bonds the largest negative contributors, driven by the portfolio’s shorter duration relative to the benchmark amid falling interest rates in the United States. Government & agency bonds, high yield, and emerging-market debt broadly tracked the benchmark, while preferred shares outperformed and partially offset the loss.
Equities were the main drag on relative performance. The portfolio’s exposure to software-related securities suffered in the sell-off driven by concerns about potential artificial intelligence disruption to corporate business models. Microsoft, U.S. cybersecurity, and Amazon were among the largest detractors. Emerging-markets equities also detracted slightly. By contrast, regional diversification, mainly across Europe and Switzerland, contributed positively.
Finally, alternative investments also detracted from our overall performance. The private equity allocation was exposed to the risk that software companies might struggle to service debt after financing, which amplified the sector sell-off. Commodities, on the other end, were positive contributors, helped by continued strength in gold and gold miners.
During February, the portfolio management team opened a new position towards mega caps software names currently trading at more attractive valuations, through a structure that limits the potential downside.
Sources: Capital Economics, Bloomberg, BCA, Empirical Research, Hussmann, WSJ, Ned Davis, mrbPartners, LFA.
This material is a marketing communication and is for informational purposes only. It does not constitute investment research, advice, a recommendation, or an offer to buy or sell any security or financial instrument. Past performance, including historical returns, prices, or yields, is not indicative of future results, and all investments involve risk, including loss of capital. Opinions, estimates, and forward-looking statements contained herein reflect LFA’s views at the time of writing and are not guarantees or forecasts. References to specific securities, indices, commodities, currencies, or cryptocurrencies are for illustrative purposes only and should not be construed as recommendations. Numerical examples and scenario analyses are based on assumptions that may change. Third-party data are believed to be reliable but are not guaranteed and may be revised. Readers should consult qualified financial, tax, and legal advisors regarding any investment, financial, or tax decision. Nothing in this material constitutes legal, tax, or accounting advice.